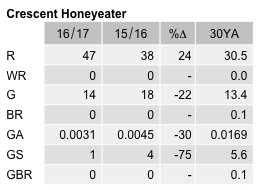
Crescent Honeyeater
Phylidonyris pyrrhopterus
ABR description
The following is extracted from the Annual Bird Report for the twelve months to June 2017.
Uncommon, breeding resident/alt. migrant
Reported mostly during the winter months.
General: 49 records this year, 38 last year but reporting rate of 0.3% is still well down on the 1.1% 30YA. Most records are of 1 or 2 birds, 45% in winter. 10 records from TNR, 4 from NNP, 3 from Tallaganda, and the remainder from lowland nature parks and ANU/ANBG during winter months. Max 5/30 Oct Kambah Pool (PeV1). Reporting rate 0.3% compared with the long-term average of 1.0%. The only breeding records are 1 in 2014 and 3 in 1990. None this year.
GBS: 8 records from a single site in Chapman (HaJ1). Records from 2-5wk Jul, then 3wk May-2wk June. Abundance dropped sharply in 2003 and has remained at very low levels since. This year A=0.0031, less than one-fifth of the 30YA.
Abundance
Abundance is the average number of birds of that species per survey. Where the species was observed (presence recorded) but the number of birds seen was not recorded, this is treated as a count of zero.
Abundance by year
This chart shows the abundance of Crescent Honeyeater between 1982 and 2017. 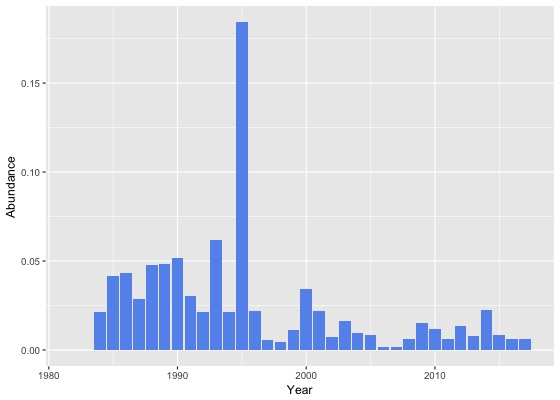
Abundance by month
This chart shows the monthly abundance of Crescent Honeyeater. The blue lines show the abundance for the twelve months to June 2017 and the bars show the average abundance for the period 1982 to 2017. 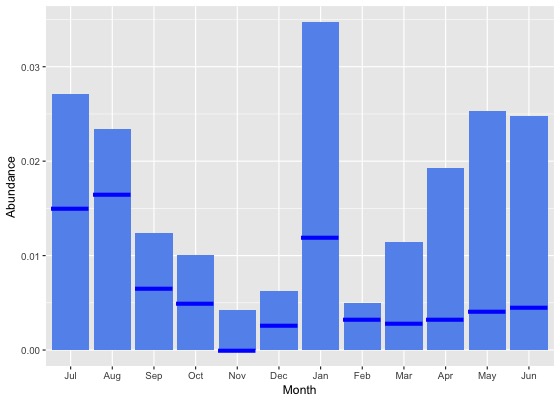
Abundance by season
This chart shows the seasonal abundance of Crescent Honeyeater. The blue lines show the seasonal abundance for the twelve months to June 2017 and the bars show the average seasonal abundance for the period 1982 to 2017. 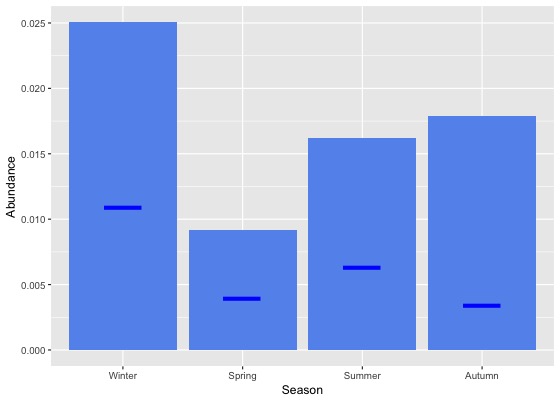
Abundance data
| Month | Season | ||||||||||||||||||
|---|---|---|---|---|---|---|---|---|---|---|---|---|---|---|---|---|---|---|---|
| Period | Jul | Aug | Sep | Oct | Nov | Dec | Jan | Feb | Mar | Apr | May | Jun | Winter | Spring | Summer | Autumn | All | ||
| All years | |||||||||||||||||||
| All | 0.0 | 0.0 | 0.0 | 0.0 | 0.0 | 0.0 | 0.0 | 0.0 | 0.0 | 0.0 | 0.0 | 0.0 | 0.0 | 0.0 | 0.0 | 0.0 | 0.0 | ||
| Previous years | |||||||||||||||||||
| All previous years | 0.0 | 0.0 | 0.0 | 0.0 | 0.0 | 0.0 | 0.0 | 0.0 | 0.0 | 0.0 | 0.0 | 0.0 | 0.0 | 0.0 | 0.0 | 0.0 | 0.0 | ||
| Previous 30 years | 0.0 | 0.0 | 0.0 | 0.0 | 0.0 | 0.0 | 0.0 | 0.0 | 0.0 | 0.0 | 0.0 | 0.0 | 0.0 | 0.0 | 0.0 | 0.0 | 0.0 | ||
| Previous 20 years | 0.0 | 0.0 | 0.0 | 0.0 | 0.0 | 0.0 | 0.0 | 0.0 | 0.0 | 0.0 | 0.0 | 0.0 | 0.0 | 0.0 | 0.0 | 0.0 | 0.0 | ||
| 10 year groups | |||||||||||||||||||
| [2007,2017) | 0.0 | 0.0 | 0.0 | 0.0 | 0.0 | 0.0 | 0.0 | 0.0 | 0.0 | 0.0 | 0.0 | 0.0 | 0.0 | 0.0 | 0.0 | 0.0 | 0.0 | ||
| [1997,2007) | 0.0 | 0.0 | 0.0 | 0.0 | 0.0 | 0.0 | 0.0 | 0.0 | 0.0 | 0.0 | 0.0 | 0.0 | 0.0 | 0.0 | 0.0 | 0.0 | 0.0 | ||
| [1987,1997) | 0.1 | 0.0 | 0.0 | 0.0 | 0.0 | 0.0 | 0.2 | 0.0 | 0.0 | 0.0 | 0.1 | 0.1 | 0.1 | 0.0 | 0.1 | 0.0 | 0.1 | ||
| 5 year groups | |||||||||||||||||||
| [2012,2017) | 0.0 | 0.0 | 0.0 | 0.0 | 0.0 | 0.0 | 0.0 | 0.0 | 0.0 | 0.0 | 0.0 | 0.0 | 0.0 | 0.0 | 0.0 | 0.0 | 0.0 | ||
| [2007,2012) | 0.0 | 0.0 | 0.0 | 0.0 | 0.0 | 0.0 | 0.0 | 0.0 | 0.0 | 0.0 | 0.0 | 0.0 | 0.0 | 0.0 | 0.0 | 0.0 | 0.0 | ||
| [2002,2007) | 0.0 | 0.0 | 0.0 | 0.0 | 0.0 | 0.0 | 0.0 | 0.0 | 0.0 | 0.0 | 0.0 | 0.0 | 0.0 | 0.0 | 0.0 | 0.0 | 0.0 | ||
| [1997,2002) | 0.0 | 0.0 | 0.0 | 0.0 | 0.0 | 0.0 | 0.0 | 0.0 | 0.0 | 0.1 | 0.0 | 0.0 | 0.0 | 0.0 | 0.0 | 0.0 | 0.0 | ||
| [1992,1997) | 0.0 | 0.0 | 0.0 | 0.0 | 0.0 | 0.0 | 0.5 | 0.0 | 0.1 | 0.0 | 0.1 | 0.1 | 0.0 | 0.0 | 0.2 | 0.1 | 0.1 | ||
| [1987,1992) | 0.1 | 0.1 | 0.1 | 0.0 | 0.0 | 0.0 | 0.0 | 0.0 | 0.0 | 0.1 | 0.1 | 0.1 | 0.1 | 0.0 | 0.0 | 0.0 | 0.0 | ||
| Year | |||||||||||||||||||
| 2017 | 0.0 | 0.0 | 0.0 | 0.0 | 0.0 | 0.0 | 0.0 | 0.0 | 0.0 | 0.0 | 0.0 | 0.0 | 0.0 | 0.0 | 0.0 | 0.0 | 0.0 | ||
| 2016 | 0.0 | 0.0 | 0.0 | 0.0 | 0.0 | 0.0 | 0.0 | 0.0 | 0.0 | 0.0 | 0.0 | 0.0 | 0.0 | 0.0 | 0.0 | 0.0 | 0.0 | ||
| 2015 | 0.0 | 0.0 | 0.0 | 0.0 | 0.0 | 0.0 | 0.0 | 0.0 | 0.0 | 0.0 | 0.0 | 0.0 | 0.0 | 0.0 | 0.0 | 0.0 | 0.0 | ||
| 2014 | 0.0 | 0.0 | 0.0 | 0.0 | 0.0 | 0.0 | 0.0 | 0.0 | 0.0 | 0.0 | 0.1 | 0.0 | 0.0 | 0.0 | 0.0 | 0.0 | 0.0 | ||
| 2013 | 0.0 | 0.0 | 0.0 | 0.0 | 0.0 | 0.0 | 0.0 | 0.0 | 0.0 | 0.0 | 0.0 | 0.0 | 0.0 | 0.0 | 0.0 | 0.0 | 0.0 | ||
| 2012 | 0.0 | 0.0 | 0.0 | 0.0 | 0.0 | 0.0 | 0.0 | 0.0 | 0.0 | 0.0 | 0.0 | 0.1 | 0.0 | 0.0 | 0.0 | 0.0 | 0.0 | ||
| 2011 | 0.0 | 0.0 | 0.0 | 0.0 | 0.0 | 0.0 | 0.0 | 0.0 | 0.0 | 0.0 | 0.0 | 0.0 | 0.0 | 0.0 | 0.0 | 0.0 | 0.0 | ||
| 2010 | 0.1 | 0.1 | 0.0 | 0.0 | 0.0 | 0.0 | 0.0 | 0.0 | 0.0 | 0.0 | 0.0 | 0.0 | 0.0 | 0.0 | 0.0 | 0.0 | 0.0 | ||
| 2009 | 0.0 | 0.0 | 0.0 | 0.0 | 0.0 | 0.0 | 0.0 | 0.0 | 0.1 | 0.0 | 0.0 | 0.0 | 0.0 | 0.0 | 0.0 | 0.0 | 0.0 | ||
| 2008 | 0.0 | 0.0 | 0.0 | 0.0 | 0.0 | 0.0 | 0.0 | 0.0 | 0.0 | 0.0 | 0.0 | 0.0 | 0.0 | 0.0 | 0.0 | 0.0 | 0.0 | ||
| 2007 | 0.0 | 0.0 | 0.0 | 0.0 | 0.0 | 0.0 | 0.0 | 0.0 | 0.0 | 0.0 | 0.0 | 0.0 | 0.0 | 0.0 | 0.0 | 0.0 | 0.0 | ||
| 2006 | 0.0 | 0.0 | 0.0 | 0.0 | 0.0 | 0.0 | 0.0 | 0.0 | 0.0 | 0.0 | 0.0 | 0.0 | 0.0 | 0.0 | 0.0 | 0.0 | 0.0 | ||
| 2005 | 0.0 | 0.0 | 0.0 | 0.0 | 0.0 | 0.0 | 0.0 | 0.0 | 0.0 | 0.0 | 0.0 | 0.0 | 0.0 | 0.0 | 0.0 | 0.0 | 0.0 | ||
| 2004 | 0.0 | 0.0 | 0.0 | 0.0 | 0.0 | 0.0 | 0.0 | 0.0 | 0.0 | 0.0 | 0.0 | 0.0 | 0.0 | 0.0 | 0.0 | 0.0 | 0.0 | ||
| 2003 | 0.0 | 0.0 | 0.0 | 0.0 | 0.0 | 0.0 | 0.0 | 0.0 | 0.1 | 0.0 | 0.0 | 0.0 | 0.0 | 0.0 | 0.0 | 0.0 | 0.0 | ||
| 2002 | 0.0 | 0.0 | 0.0 | 0.0 | 0.0 | 0.0 | 0.0 | 0.0 | 0.0 | 0.0 | 0.0 | 0.0 | 0.0 | 0.0 | 0.0 | 0.0 | 0.0 | ||
| 2001 | 0.0 | 0.1 | 0.0 | 0.0 | 0.0 | 0.0 | 0.0 | 0.0 | 0.0 | 0.0 | 0.1 | 0.0 | 0.0 | 0.0 | 0.0 | 0.0 | 0.0 | ||
| 2000 | 0.1 | 0.0 | 0.0 | 0.0 | 0.0 | 0.1 | 0.0 | 0.0 | 0.0 | 0.2 | 0.0 | 0.0 | 0.0 | 0.0 | 0.0 | 0.1 | 0.0 | ||
| 1999 | 0.0 | 0.0 | 0.0 | 0.0 | 0.0 | 0.0 | 0.0 | 0.0 | 0.0 | 0.0 | 0.0 | 0.0 | 0.0 | 0.0 | 0.0 | 0.0 | 0.0 | ||
| 1998 | 0.0 | 0.0 | 0.0 | 0.0 | 0.0 | 0.0 | 0.0 | 0.0 | 0.0 | 0.0 | 0.0 | 0.0 | 0.0 | 0.0 | 0.0 | 0.0 | 0.0 | ||
| 1997 | 0.0 | 0.0 | 0.0 | 0.0 | 0.0 | 0.0 | 0.0 | 0.0 | 0.0 | 0.0 | 0.0 | 0.0 | 0.0 | 0.0 | 0.0 | 0.0 | 0.0 | ||
| 1996 | 0.0 | 0.0 | 0.0 | 0.0 | 0.0 | 0.0 | 0.0 | 0.0 | 0.0 | 0.0 | 0.2 | 0.0 | 0.0 | 0.0 | 0.0 | 0.1 | 0.0 | ||
| 1995 | 0.0 | 0.0 | 0.0 | 0.0 | 0.0 | 0.0 | 1.8 | 0.0 | 0.1 | 0.0 | 0.0 | 0.0 | 0.0 | 0.0 | 0.8 | 0.0 | 0.2 | ||
| 1994 | 0.0 | 0.0 | 0.0 | 0.0 | 0.0 | 0.0 | 0.0 | 0.1 | 0.0 | 0.0 | 0.0 | 0.1 | 0.0 | 0.0 | 0.0 | 0.0 | 0.0 | ||
| 1993 | 0.1 | 0.0 | 0.0 | 0.0 | 0.0 | 0.0 | 0.1 | 0.0 | 0.3 | 0.0 | 0.0 | 0.1 | 0.1 | 0.0 | 0.0 | 0.1 | 0.1 | ||
| 1992 | 0.0 | 0.0 | 0.0 | 0.1 | 0.0 | 0.0 | 0.0 | 0.0 | 0.0 | 0.0 | 0.1 | 0.0 | 0.0 | 0.0 | 0.0 | 0.0 | 0.0 | ||
| 1991 | 0.0 | 0.0 | 0.0 | 0.0 | 0.0 | 0.0 | 0.0 | 0.0 | 0.0 | 0.1 | 0.0 | 0.2 | 0.1 | 0.0 | 0.0 | 0.0 | 0.0 | ||
| 1990 | 0.1 | 0.1 | 0.1 | 0.0 | 0.0 | 0.0 | 0.0 | 0.0 | 0.0 | 0.1 | 0.1 | 0.1 | 0.1 | 0.0 | 0.0 | 0.0 | 0.1 | ||
| 1989 | 0.1 | 0.1 | 0.1 | 0.0 | 0.0 | 0.0 | 0.0 | 0.0 | 0.0 | 0.0 | 0.1 | 0.1 | 0.1 | 0.0 | 0.0 | 0.1 | 0.0 | ||
| 1988 | 0.1 | 0.1 | 0.1 | 0.0 | 0.0 | 0.0 | 0.0 | 0.0 | 0.0 | 0.1 | 0.1 | 0.1 | 0.1 | 0.0 | 0.0 | 0.1 | 0.0 | ||
| 1987 | 0.1 | 0.1 | 0.0 | 0.0 | 0.0 | 0.0 | 0.0 | 0.0 | 0.0 | 0.0 | 0.1 | 0.1 | 0.1 | 0.0 | 0.0 | 0.0 | 0.0 | ||
| 1986 | 0.0 | 0.1 | 0.1 | 0.1 | 0.0 | 0.0 | 0.0 | 0.0 | 0.0 | 0.0 | 0.1 | 0.0 | 0.1 | 0.1 | 0.0 | 0.0 | 0.0 | ||
| 1985 | 0.2 | 0.1 | 0.0 | 0.0 | 0.0 | 0.0 | 0.0 | 0.0 | 0.0 | 0.1 | 0.1 | 0.2 | 0.1 | 0.0 | 0.0 | 0.1 | 0.0 | ||
| 1984 | 0.0 | 0.0 | 0.0 | 0.0 | 0.0 | 0.0 | 0.0 | 0.0 | 0.0 | 0.0 | 0.0 | 0.1 | 0.1 | 0.0 | 0.0 | 0.0 | 0.0 | ||
| 1983 | 0.0 | 0.0 | 0.0 | 0.0 | 0.0 | 0.0 | 0.0 | 0.0 | 0.0 | - | 0.0 | 0.0 | 0.0 | 0.0 | 0.0 | 0.0 | 0.0 | ||
| 1982 | - | 0.0 | - | 0.0 | 0.0 | 0.0 | - | 0.0 | - | 0.0 | - | 0.0 | 0.0 | 0.0 | 0.0 | 0.0 | 0.0 | ||
Reporting rates
Reporting rate is the proportion of all surveys in which the species was present.
Reporting rate by year
This chart shows the reporting rate of Crescent Honeyeater each year between 1982 and 2017. 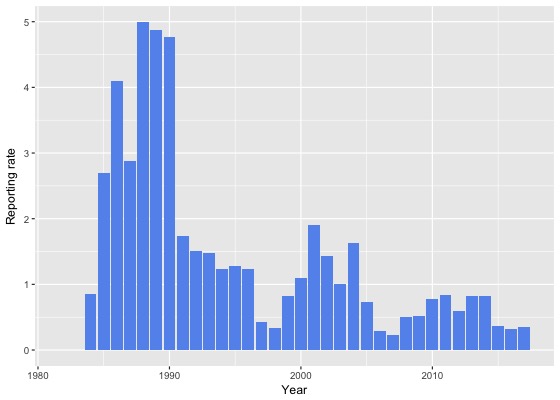
Reporting rate by month
This chart shows the reporting rate by month of Crescent Honeyeater. The blue lines show the reporting rate for the twelve months to June 2017 and the bars show the average reporting rate for the period 1982 to 2017. 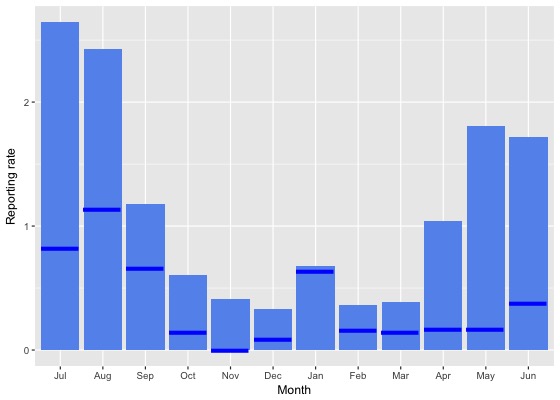
Reporting rate by season
This chart shows the seasonal reporting rate of Crescent Honeyeater. The blue lines show the seasonal reporting rate for the twelve months to June 2017 and the bars show the average seasonal reporting rate for the period 1982 to 2017. 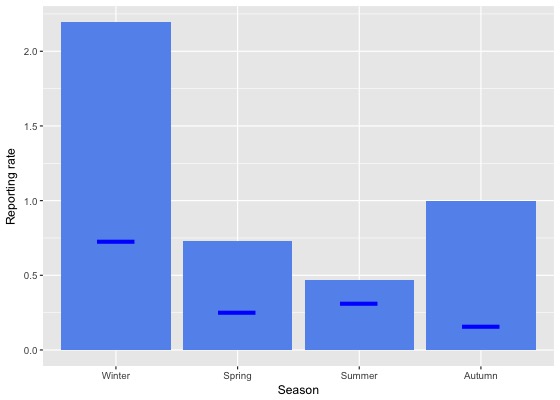
Reporting rate data
| Month | Season | ||||||||||||||||||
|---|---|---|---|---|---|---|---|---|---|---|---|---|---|---|---|---|---|---|---|
| Period | Jul | Aug | Sep | Oct | Nov | Dec | Jan | Feb | Mar | Apr | May | Jun | Winter | Spring | Summer | Autumn | All | ||
| All years | |||||||||||||||||||
| All | 2.6 | 2.4 | 1.2 | 0.6 | 0.4 | 0.3 | 0.7 | 0.4 | 0.4 | 1.0 | 1.8 | 1.7 | 2.2 | 0.7 | 0.5 | 1.0 | 1.0 | ||
| Previous years | |||||||||||||||||||
| All previous years | 2.9 | 2.7 | 1.3 | 0.7 | 0.5 | 0.4 | 0.7 | 0.4 | 0.4 | 1.2 | 2.2 | 2.0 | 2.5 | 0.8 | 0.5 | 1.2 | 1.1 | ||
| Previous 30 years | 2.9 | 2.6 | 1.2 | 0.7 | 0.5 | 0.4 | 0.7 | 0.4 | 0.4 | 1.2 | 2.1 | 1.9 | 2.4 | 0.8 | 0.5 | 1.1 | 1.1 | ||
| Previous 20 years | 2.0 | 1.9 | 0.6 | 0.4 | 0.3 | 0.3 | 0.5 | 0.2 | 0.3 | 0.7 | 1.1 | 1.1 | 1.6 | 0.4 | 0.4 | 0.6 | 0.7 | ||
| 10 year groups | |||||||||||||||||||
| [2007,2017) | 1.3 | 1.0 | 0.5 | 0.3 | 0.2 | 0.2 | 0.6 | 0.1 | 0.3 | 0.6 | 1.0 | 1.1 | 1.1 | 0.3 | 0.4 | 0.6 | 0.5 | ||
| [1997,2007) | 3.1 | 4.0 | 1.0 | 0.6 | 0.5 | 0.5 | 0.3 | 0.3 | 0.3 | 1.0 | 1.4 | 1.3 | 2.6 | 0.7 | 0.4 | 0.8 | 1.1 | ||
| [1987,1997) | 6.0 | 4.7 | 4.1 | 2.5 | 1.2 | 0.8 | 1.5 | 1.5 | 1.2 | 3.7 | 5.8 | 5.8 | 5.5 | 2.5 | 1.2 | 3.5 | 3.2 | ||
| 5 year groups | |||||||||||||||||||
| [2012,2017) | 0.9 | 0.6 | 0.4 | 0.3 | 0.2 | 0.2 | 0.7 | 0.2 | 0.3 | 0.7 | 0.9 | 1.1 | 0.9 | 0.3 | 0.4 | 0.6 | 0.5 | ||
| [2007,2012) | 2.5 | 2.5 | 0.5 | 0.3 | 0.0 | 0.1 | 0.4 | 0.0 | 0.3 | 0.3 | 1.3 | 1.0 | 1.7 | 0.3 | 0.2 | 0.5 | 0.6 | ||
| [2002,2007) | 3.1 | 4.4 | 1.2 | 0.7 | 0.4 | 0.3 | 0.5 | 0.2 | 0.2 | 0.4 | 0.9 | 1.1 | 2.6 | 0.8 | 0.3 | 0.4 | 1.0 | ||
| [1997,2002) | 3.1 | 3.6 | 0.7 | 0.5 | 0.5 | 0.7 | 0.0 | 0.5 | 0.6 | 1.7 | 2.1 | 1.6 | 2.6 | 0.6 | 0.4 | 1.3 | 1.1 | ||
| [1992,1997) | 3.1 | 1.2 | 0.8 | 0.8 | 0.4 | 0.3 | 1.8 | 0.7 | 1.4 | 0.9 | 3.0 | 2.3 | 2.1 | 0.6 | 1.0 | 1.7 | 1.3 | ||
| [1987,1992) | 7.4 | 6.7 | 5.6 | 3.4 | 1.6 | 1.0 | 1.3 | 1.8 | 1.1 | 5.3 | 7.3 | 7.8 | 7.3 | 3.4 | 1.4 | 4.5 | 4.1 | ||
| Year | |||||||||||||||||||
| 2017 | 0.8 | 1.1 | 0.7 | 0.1 | 0.0 | 0.1 | 0.6 | 0.2 | 0.1 | 0.2 | 0.2 | 0.4 | 0.7 | 0.3 | 0.3 | 0.2 | 0.3 | ||
| 2016 | 0.5 | 0.1 | 0.6 | 0.4 | 0.0 | 0.0 | 0.7 | 0.2 | 0.1 | 0.3 | 0.3 | 0.7 | 0.4 | 0.4 | 0.3 | 0.2 | 0.3 | ||
| 2015 | 0.5 | 0.4 | 0.3 | 0.1 | 0.0 | 0.0 | 0.2 | 0.3 | 0.8 | 0.7 | 0.5 | 0.8 | 0.6 | 0.1 | 0.2 | 0.7 | 0.4 | ||
| 2014 | 2.4 | 1.7 | 0.5 | 0.3 | 0.0 | 1.1 | 1.3 | 0.0 | 0.0 | 1.3 | 1.8 | 1.0 | 1.5 | 0.3 | 0.9 | 0.9 | 0.8 | ||
| 2013 | 0.9 | 0.9 | 0.5 | 0.2 | 0.8 | 0.5 | 0.6 | 0.3 | 0.2 | 1.2 | 3.3 | 2.9 | 1.7 | 0.4 | 0.5 | 1.2 | 0.8 | ||
| 2012 | 1.6 | 0.8 | 0.2 | 0.3 | 0.8 | 0.3 | 0.9 | 0.0 | 0.3 | 0.6 | 0.0 | 1.5 | 1.3 | 0.4 | 0.5 | 0.3 | 0.6 | ||
| 2011 | 4.1 | 4.0 | 1.2 | 0.2 | 0.0 | 0.0 | 1.2 | 0.0 | 0.0 | 0.0 | 1.1 | 2.0 | 2.9 | 0.4 | 0.4 | 0.3 | 0.8 | ||
| 2010 | 7.3 | 2.6 | 0.0 | 0.4 | 0.0 | 0.0 | 0.0 | 0.0 | 0.0 | 0.9 | 2.9 | 1.1 | 2.8 | 0.2 | 0.0 | 0.8 | 0.8 | ||
| 2009 | 0.0 | 0.0 | 1.5 | 0.9 | 0.0 | 0.0 | 0.0 | 0.0 | 1.4 | 0.4 | 0.0 | 0.0 | 0.0 | 0.9 | 0.0 | 0.7 | 0.5 | ||
| 2008 | 2.1 | 1.7 | 0.0 | 0.0 | 0.0 | 0.5 | 0.0 | 0.0 | 0.0 | 0.3 | 2.7 | 1.4 | 1.7 | 0.0 | 0.2 | 0.6 | 0.5 | ||
| 2007 | 0.0 | 3.7 | 0.0 | 0.0 | 0.0 | 0.0 | 0.0 | 0.0 | 0.4 | 0.0 | 0.8 | 0.0 | 0.8 | 0.0 | 0.0 | 0.3 | 0.2 | ||
| 2006 | 1.3 | 2.9 | 0.0 | 0.0 | 0.0 | 0.0 | 0.6 | 0.7 | 0.0 | 0.0 | 0.0 | 0.0 | 1.0 | 0.0 | 0.4 | 0.0 | 0.3 | ||
| 2005 | 0.7 | 1.9 | 0.0 | 0.6 | 2.1 | 1.6 | 0.7 | 0.0 | 0.0 | 0.0 | 0.5 | 1.1 | 1.2 | 0.7 | 1.0 | 0.2 | 0.7 | ||
| 2004 | 5.6 | 5.3 | 2.4 | 4.1 | 0.0 | 0.0 | 0.0 | 0.0 | 0.0 | 0.0 | 0.0 | 0.0 | 3.9 | 2.2 | 0.0 | 0.0 | 1.6 | ||
| 2003 | 0.0 | 2.9 | 0.8 | 0.0 | 0.0 | 0.0 | 1.5 | 0.0 | 0.9 | 1.4 | 3.1 | 3.1 | 2.2 | 0.3 | 0.4 | 1.6 | 1.0 | ||
| 2002 | 5.1 | 8.5 | 3.5 | 0.0 | 0.5 | 0.0 | 0.0 | 0.0 | 0.0 | 0.6 | 1.2 | 1.6 | 4.6 | 1.3 | 0.0 | 0.4 | 1.4 | ||
| 2001 | 3.6 | 7.2 | 1.5 | 0.8 | 0.0 | 1.4 | 0.0 | 0.5 | 0.3 | 1.0 | 5.2 | 3.9 | 4.7 | 0.9 | 0.7 | 1.7 | 1.9 | ||
| 2000 | 4.0 | 1.3 | 0.0 | 0.0 | 1.9 | 1.0 | 0.0 | 0.0 | 1.2 | 3.1 | 0.9 | 1.1 | 1.9 | 0.6 | 0.4 | 1.9 | 1.1 | ||
| 1999 | 0.0 | 3.1 | 0.6 | 1.3 | 0.0 | 0.0 | 0.0 | 0.7 | 0.5 | 2.1 | 0.6 | 0.9 | 1.4 | 0.6 | 0.2 | 1.1 | 0.8 | ||
| 1998 | 0.0 | 1.9 | 0.8 | 0.0 | 0.0 | 0.0 | 0.0 | 1.9 | 0.0 | 0.0 | 0.0 | 0.0 | 0.6 | 0.3 | 0.4 | 0.0 | 0.3 | ||
| 1997 | 3.4 | 1.7 | 0.0 | 0.0 | 0.0 | 0.0 | 0.0 | 0.0 | 0.0 | 0.0 | 0.0 | 0.0 | 1.8 | 0.0 | 0.0 | 0.0 | 0.4 | ||
| 1996 | 4.5 | 2.1 | 0.0 | 0.9 | 0.0 | 1.0 | 0.0 | 0.0 | 0.0 | 1.6 | 6.9 | 1.1 | 2.4 | 0.3 | 0.3 | 2.2 | 1.2 | ||
| 1995 | 4.3 | 1.6 | 0.0 | 0.0 | 0.9 | 0.0 | 3.5 | 0.0 | 1.0 | 1.6 | 1.3 | 1.1 | 2.2 | 0.3 | 1.5 | 1.3 | 1.3 | ||
| 1994 | 3.9 | 1.3 | 1.5 | 0.0 | 0.0 | 0.0 | 1.5 | 3.4 | 0.0 | 0.8 | 0.0 | 4.5 | 3.2 | 0.3 | 1.7 | 0.3 | 1.2 | ||
| 1993 | 2.0 | 0.0 | 0.0 | 0.0 | 1.5 | 0.0 | 4.1 | 0.0 | 4.9 | 0.0 | 1.3 | 2.9 | 1.5 | 0.5 | 1.6 | 2.3 | 1.5 | ||
| 1992 | 0.0 | 0.0 | 2.4 | 3.2 | 0.0 | 0.0 | 0.0 | 0.0 | 1.4 | 0.0 | 6.6 | 1.7 | 0.6 | 2.0 | 0.0 | 2.9 | 1.5 | ||
| 1991 | 0.8 | 2.1 | 2.3 | 1.9 | 1.0 | 0.0 | 0.0 | 0.0 | 0.0 | 8.5 | 0.0 | 6.0 | 2.2 | 1.7 | 0.0 | 2.7 | 1.7 | ||
| 1990 | 7.7 | 8.6 | 9.7 | 2.0 | 2.8 | 1.4 | 0.0 | 4.2 | 0.0 | 3.6 | 6.8 | 2.6 | 7.2 | 4.7 | 1.9 | 3.3 | 4.8 | ||
| 1989 | 9.2 | 7.3 | 6.6 | 4.2 | 0.5 | 0.9 | 1.6 | 2.1 | 1.1 | 4.6 | 12.5 | 10.1 | 8.7 | 3.9 | 1.5 | 5.7 | 4.9 | ||
| 1988 | 9.1 | 6.3 | 6.2 | 3.9 | 2.4 | 1.0 | 2.0 | 2.3 | 2.5 | 9.1 | 8.1 | 7.2 | 7.5 | 3.9 | 1.8 | 6.5 | 5.0 | ||
| 1987 | 9.1 | 6.7 | 4.0 | 3.1 | 1.2 | 1.4 | 1.0 | 0.8 | 0.5 | 2.9 | 5.2 | 8.8 | 8.7 | 2.6 | 1.1 | 2.9 | 2.9 | ||
| 1986 | 11.5 | 10.5 | 7.5 | 5.6 | 0.0 | 0.0 | 4.3 | 0.0 | 0.0 | 2.0 | 6.9 | 2.9 | 8.1 | 4.4 | 1.1 | 2.7 | 4.1 | ||
| 1985 | 3.3 | 3.3 | 1.9 | 0.0 | 0.0 | 0.0 | 0.0 | 0.0 | 0.0 | 5.3 | 20.0 | 17.9 | 8.0 | 0.5 | 0.0 | 7.5 | 2.7 | ||
| 1984 | 0.0 | 0.0 | 0.0 | 0.0 | 0.0 | 0.0 | 0.0 | 0.0 | 0.0 | 0.0 | 3.2 | 2.9 | 2.0 | 0.0 | 0.0 | 1.1 | 0.8 | ||
| 1983 | 0.0 | 0.0 | 0.0 | 0.0 | 0.0 | 0.0 | 0.0 | 0.0 | 0.0 | - | 0.0 | 0.0 | 0.0 | 0.0 | 0.0 | 0.0 | 0.0 | ||
| 1982 | - | 0.0 | - | 0.0 | 0.0 | 0.0 | - | 0.0 | - | 0.0 | - | 0.0 | 0.0 | 0.0 | 0.0 | 0.0 | 0.0 | ||
Breeding data
Breeding records by month
Number of breeding records by breeding code and month, 2017 and all years| Breeding code | Jul | Aug | Sep | Oct | Nov | Dec | Jan | Feb | Mar | Apr | May | Jun |
|---|---|---|---|---|---|---|---|---|---|---|---|---|
| 2017 | ||||||||||||
| Breeding (BLA code) | 0 | 0 | 0 | 0 | 0 | 0 | 0 | 0 | 0 | 0 | 0 | 0 |
| Carrying Food | 0 | 0 | 0 | 0 | 0 | 0 | 0 | 0 | 0 | 0 | 0 | 0 |
| Copulating | 0 | 0 | 0 | 0 | 0 | 0 | 0 | 0 | 0 | 0 | 0 | 0 |
| Display | 0 | 0 | 0 | 0 | 0 | 0 | 0 | 0 | 0 | 0 | 0 | 0 |
| Dependent young | 0 | 0 | 0 | 0 | 0 | 0 | 0 | 0 | 0 | 0 | 0 | 0 |
| Faecal sac | 0 | 0 | 0 | 0 | 0 | 0 | 0 | 0 | 0 | 0 | 0 | 0 |
| Inspecting hollow | 0 | 0 | 0 | 0 | 0 | 0 | 0 | 0 | 0 | 0 | 0 | 0 |
| Nest building | 0 | 0 | 0 | 0 | 0 | 0 | 0 | 0 | 0 | 0 | 0 | 0 |
| Nest with eggs | 0 | 0 | 0 | 0 | 0 | 0 | 0 | 0 | 0 | 0 | 0 | 0 |
| Nest with young | 0 | 0 | 0 | 0 | 0 | 0 | 0 | 0 | 0 | 0 | 0 | 0 |
| On/leaving nest | 0 | 0 | 0 | 0 | 0 | 0 | 0 | 0 | 0 | 0 | 0 | 0 |
| All years | ||||||||||||
| Breeding (BLA code) | 0 | 0 | 0 | 1 | 0 | 0 | 0 | 0 | 0 | 0 | 0 | 0 |
| Carrying Food | 0 | 0 | 0 | 0 | 0 | 0 | 0 | 0 | 0 | 0 | 0 | 0 |
| Copulating | 0 | 0 | 0 | 0 | 0 | 0 | 0 | 0 | 0 | 0 | 0 | 0 |
| Display | 0 | 0 | 0 | 0 | 0 | 0 | 0 | 0 | 0 | 0 | 0 | 0 |
| Dependent young | 0 | 0 | 0 | 1 | 2 | 0 | 0 | 0 | 0 | 0 | 0 | 0 |
| Faecal sac | 0 | 0 | 0 | 0 | 0 | 0 | 0 | 0 | 0 | 0 | 0 | 0 |
| Inspecting hollow | 0 | 0 | 0 | 0 | 0 | 0 | 0 | 0 | 0 | 0 | 0 | 0 |
| Nest building | 0 | 0 | 0 | 0 | 0 | 0 | 0 | 0 | 0 | 0 | 0 | 0 |
| Nest with eggs | 0 | 0 | 0 | 0 | 0 | 0 | 0 | 0 | 0 | 0 | 0 | 0 |
| Nest with young | 0 | 0 | 0 | 0 | 0 | 0 | 0 | 0 | 0 | 0 | 0 | 0 |
| On/leaving nest | 0 | 0 | 0 | 0 | 0 | 0 | 0 | 0 | 0 | 0 | 0 | 0 |
Breeding records by year
Average number of breeding records per period by breeding code| Period | Breeding (BLA code) | Carrying Food | Copulating | Display | Dependent young | Faecal sac | Inspecting hollow | Nest building | Nest with eggs | Nest with young | On/leaving nest |
|---|---|---|---|---|---|---|---|---|---|---|---|
| All years | |||||||||||
| All | 0.0 | 0.0 | 0.0 | 0.0 | 0.1 | 0.0 | 0.0 | 0.0 | 0.0 | 0.0 | 0.0 |
| Previous years | |||||||||||
| All previous years | 0.0 | 0.0 | 0.0 | 0.0 | 0.1 | 0.0 | 0.0 | 0.0 | 0.0 | 0.0 | 0.0 |
| Previous 30 years | 0.0 | 0.0 | 0.0 | 0.0 | 0.1 | 0.0 | 0.0 | 0.0 | 0.0 | 0.0 | 0.0 |
| Previous 20 years | 0.0 | 0.0 | 0.0 | 0.0 | 0.0 | 0.0 | 0.0 | 0.0 | 0.0 | 0.0 | 0.0 |
| 10 year groups | |||||||||||
| [2007,2017) | 0.1 | 0.0 | 0.0 | 0.0 | 0.0 | 0.0 | 0.0 | 0.0 | 0.0 | 0.0 | 0.0 |
| [1997,2007) | 0.0 | 0.0 | 0.0 | 0.0 | 0.0 | 0.0 | 0.0 | 0.0 | 0.0 | 0.0 | 0.0 |
| [1987,1997) | 0.0 | 0.0 | 0.0 | 0.0 | 0.3 | 0.0 | 0.0 | 0.0 | 0.0 | 0.0 | 0.0 |
| 5 year groups | |||||||||||
| [2012,2017) | 0.2 | 0.0 | 0.0 | 0.0 | 0.0 | 0.0 | 0.0 | 0.0 | 0.0 | 0.0 | 0.0 |
| [2007,2012) | 0.0 | 0.0 | 0.0 | 0.0 | 0.0 | 0.0 | 0.0 | 0.0 | 0.0 | 0.0 | 0.0 |
| [2002,2007) | 0.0 | 0.0 | 0.0 | 0.0 | 0.0 | 0.0 | 0.0 | 0.0 | 0.0 | 0.0 | 0.0 |
| [1997,2002) | 0.0 | 0.0 | 0.0 | 0.0 | 0.0 | 0.0 | 0.0 | 0.0 | 0.0 | 0.0 | 0.0 |
| [1992,1997) | 0.0 | 0.0 | 0.0 | 0.0 | 0.0 | 0.0 | 0.0 | 0.0 | 0.0 | 0.0 | 0.0 |
| [1987,1992) | 0.0 | 0.0 | 0.0 | 0.0 | 0.6 | 0.0 | 0.0 | 0.0 | 0.0 | 0.0 | 0.0 |
| Year | |||||||||||
| 2017 | 0.0 | 0.0 | 0.0 | 0.0 | 0.0 | 0.0 | 0.0 | 0.0 | 0.0 | 0.0 | 0.0 |
| 2016 | 0.0 | 0.0 | 0.0 | 0.0 | 0.0 | 0.0 | 0.0 | 0.0 | 0.0 | 0.0 | 0.0 |
| 2015 | 0.0 | 0.0 | 0.0 | 0.0 | 0.0 | 0.0 | 0.0 | 0.0 | 0.0 | 0.0 | 0.0 |
| 2014 | 1.0 | 0.0 | 0.0 | 0.0 | 0.0 | 0.0 | 0.0 | 0.0 | 0.0 | 0.0 | 0.0 |
| 2013 | 0.0 | 0.0 | 0.0 | 0.0 | 0.0 | 0.0 | 0.0 | 0.0 | 0.0 | 0.0 | 0.0 |
| 2012 | 0.0 | 0.0 | 0.0 | 0.0 | 0.0 | 0.0 | 0.0 | 0.0 | 0.0 | 0.0 | 0.0 |
| 2011 | 0.0 | 0.0 | 0.0 | 0.0 | 0.0 | 0.0 | 0.0 | 0.0 | 0.0 | 0.0 | 0.0 |
| 2010 | 0.0 | 0.0 | 0.0 | 0.0 | 0.0 | 0.0 | 0.0 | 0.0 | 0.0 | 0.0 | 0.0 |
| 2009 | 0.0 | 0.0 | 0.0 | 0.0 | 0.0 | 0.0 | 0.0 | 0.0 | 0.0 | 0.0 | 0.0 |
| 2008 | 0.0 | 0.0 | 0.0 | 0.0 | 0.0 | 0.0 | 0.0 | 0.0 | 0.0 | 0.0 | 0.0 |
| 2007 | 0.0 | 0.0 | 0.0 | 0.0 | 0.0 | 0.0 | 0.0 | 0.0 | 0.0 | 0.0 | 0.0 |
| 2006 | 0.0 | 0.0 | 0.0 | 0.0 | 0.0 | 0.0 | 0.0 | 0.0 | 0.0 | 0.0 | 0.0 |
| 2005 | 0.0 | 0.0 | 0.0 | 0.0 | 0.0 | 0.0 | 0.0 | 0.0 | 0.0 | 0.0 | 0.0 |
| 2004 | 0.0 | 0.0 | 0.0 | 0.0 | 0.0 | 0.0 | 0.0 | 0.0 | 0.0 | 0.0 | 0.0 |
| 2003 | 0.0 | 0.0 | 0.0 | 0.0 | 0.0 | 0.0 | 0.0 | 0.0 | 0.0 | 0.0 | 0.0 |
| 2002 | 0.0 | 0.0 | 0.0 | 0.0 | 0.0 | 0.0 | 0.0 | 0.0 | 0.0 | 0.0 | 0.0 |
| 2001 | 0.0 | 0.0 | 0.0 | 0.0 | 0.0 | 0.0 | 0.0 | 0.0 | 0.0 | 0.0 | 0.0 |
| 2000 | 0.0 | 0.0 | 0.0 | 0.0 | 0.0 | 0.0 | 0.0 | 0.0 | 0.0 | 0.0 | 0.0 |
| 1999 | 0.0 | 0.0 | 0.0 | 0.0 | 0.0 | 0.0 | 0.0 | 0.0 | 0.0 | 0.0 | 0.0 |
| 1998 | 0.0 | 0.0 | 0.0 | 0.0 | 0.0 | 0.0 | 0.0 | 0.0 | 0.0 | 0.0 | 0.0 |
| 1997 | 0.0 | 0.0 | 0.0 | 0.0 | 0.0 | 0.0 | 0.0 | 0.0 | 0.0 | 0.0 | 0.0 |
| 1996 | 0.0 | 0.0 | 0.0 | 0.0 | 0.0 | 0.0 | 0.0 | 0.0 | 0.0 | 0.0 | 0.0 |
| 1995 | 0.0 | 0.0 | 0.0 | 0.0 | 0.0 | 0.0 | 0.0 | 0.0 | 0.0 | 0.0 | 0.0 |
| 1994 | 0.0 | 0.0 | 0.0 | 0.0 | 0.0 | 0.0 | 0.0 | 0.0 | 0.0 | 0.0 | 0.0 |
| 1993 | 0.0 | 0.0 | 0.0 | 0.0 | 0.0 | 0.0 | 0.0 | 0.0 | 0.0 | 0.0 | 0.0 |
| 1992 | 0.0 | 0.0 | 0.0 | 0.0 | 0.0 | 0.0 | 0.0 | 0.0 | 0.0 | 0.0 | 0.0 |
| 1991 | 0.0 | 0.0 | 0.0 | 0.0 | 0.0 | 0.0 | 0.0 | 0.0 | 0.0 | 0.0 | 0.0 |
| 1990 | 0.0 | 0.0 | 0.0 | 0.0 | 3.0 | 0.0 | 0.0 | 0.0 | 0.0 | 0.0 | 0.0 |
| 1989 | 0.0 | 0.0 | 0.0 | 0.0 | 0.0 | 0.0 | 0.0 | 0.0 | 0.0 | 0.0 | 0.0 |
| 1988 | 0.0 | 0.0 | 0.0 | 0.0 | 0.0 | 0.0 | 0.0 | 0.0 | 0.0 | 0.0 | 0.0 |
| 1987 | 0.0 | 0.0 | 0.0 | 0.0 | 0.0 | 0.0 | 0.0 | 0.0 | 0.0 | 0.0 | 0.0 |
| 1986 | 0.0 | 0.0 | 0.0 | 0.0 | 0.0 | 0.0 | 0.0 | 0.0 | 0.0 | 0.0 | 0.0 |
| 1985 | 0.0 | 0.0 | 0.0 | 0.0 | 0.0 | 0.0 | 0.0 | 0.0 | 0.0 | 0.0 | 0.0 |
| 1984 | 0.0 | 0.0 | 0.0 | 0.0 | 0.0 | 0.0 | 0.0 | 0.0 | 0.0 | 0.0 | 0.0 |
| 1983 | 0.0 | 0.0 | 0.0 | 0.0 | 0.0 | 0.0 | 0.0 | 0.0 | 0.0 | 0.0 | 0.0 |
| 1982 | 0.0 | 0.0 | 0.0 | 0.0 | 0.0 | 0.0 | 0.0 | 0.0 | 0.0 | 0.0 | 0.0 |
Distribution map
Distribution - 2017
This map shows the observed distribution of the Crescent Honeyeater for 2017.
The red circles are the grid cells where Crescent Honeyeater have been reported.
The transparency of the red circles indicate how many surveys sheets were submitted for that grid cell; the darker the red the more reliable the data. Of the 315 grid cells with reports, 83 had only one sheet; an example is grid number U17.
The size of the circle represents the reporting rate. The maximum reporting rate for Crescent Honeyeater was 100.0% (eg grid number U17) and the minimum was 1.6% (eg grid number K13). 
Distribution - all years
This map shows the observed distribution of the Crescent Honeyeater for all years.
The red circles are the grid cells where Crescent Honeyeater have been reported.
The transparency of the red circles indicate how many surveys sheets were submitted for that grid cell; the darker the red the more reliable the data. Of the 703 grid cells with reports, 55 had only one sheet; an example is grid number U26.
The size of the circle represents the reporting rate. The maximum reporting rate for Crescent Honeyeater was 100.0% (eg grid number U26) and the minimum was 0.0% (eg grid number L13). 
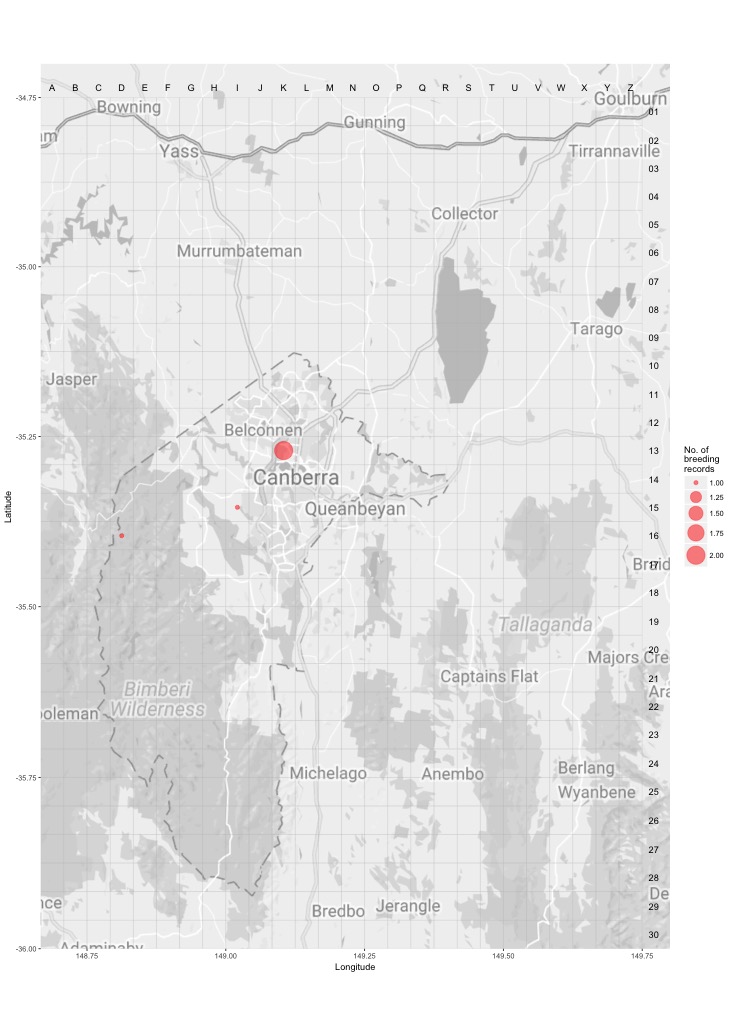
Breeding map
Breeding - 2017
This map shows the breeding distribution of the Crescent Honeyeater for 2017.
The red circles are the grid cells where breeding activity for Crescent Honeyeater have been reported.
The size of the circle represents the number of reports. 
Breeding - all years
This map shows the breeding distribution of the Crescent Honeyeater for all years.
The red circles are the grid cells where breeding activity for Crescent Honeyeater have been reported.
The size of the circle represents the number of reports.